Hat Trick University: Hockey Statistics
Welcome back to Hat Trick University! Today we’re breaking down all the basic statistics that are frequently mentioned and used in hockey. Because there are different statistics for skaters, goaltenders and the overall team, this article will be broken into corresponding sections so you know what stats are used for what.
Skater Statistics
The skaters (forwards and defenders) have the most extensive list of stats as they make up the majority of players in hockey. When you look up a player’s stats, five categories will always be listed in their basic stat line: games played, goals, assists, points and plus/minus rating. Games played (GP) is simply the amount of games a player has appeared in. Goals (G) are the amount of goals a player has scored and assists (A) are the amount of assists a player has collected. At a more advanced level, a player’s total number of goals can be split into categories to differentiate between the type of goal (even strength, power play, empty net, game winning, etc) and assists can be split into the primary and secondary categories. A player’s points (PTS) are calculated by adding their goals and assists together. And the plus/minus rating (+/-) represents a player’s goal differential, how many goals for and against they’ve been on the ice for.
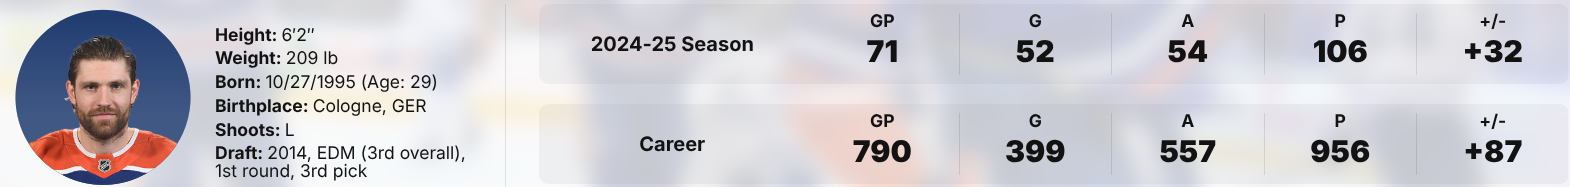
Leon Draisaitl 2024-25 season and career stat line (nhl.com)
Some other skater stats that are commonly referenced are penalty minutes, faceoff win percentage, shooting percentage and time on ice. Penalty minutes (PIM) represents the amount of minutes a player has accumulated based on penalties they have served. Faceoff win percentage (FOW%) is simply the percentage of faceoffs a player has won. This stat is most important for centers as they are almost always the ones taking faceoffs. Shooting percentage (S%) is the percentage of shots a player takes that end up being goals. For example, if a player has taken 10 shots and scored five goals, their shooting percentage will be 50.0%. For anyone who plays the entire season, this number rarely exceeds 25.0%. And time on ice (TOI) is the amount of time a player has spent on the ice. This stat can be used to show how much a single player was on the ice in a single game or what their average time on ice throughout the season is.
All of these stats can be displayed to show information just for a single season, across multiple seasons and a player’s entire career.
Goaltender Statistics
Although goaltenders can score goals, pick up assists and accumulate penalty minutes, they have their own set of unique statistics which are record, goals against average, save percentage and shutouts. A goaltender’s record reflects the amount of wins, losses and overtime/shootout losses they have been in net for. It is always displayed by three numbers with hyphens between (ex. 20-15-7). Goals against average (GAA) is the average amount of goals a goaltender allows while on the ice. The lower the number the better. Save percentage (SV%) is the percentage of shots that a goaltender stops while on the ice. This number can be calculated by dividing the amount of saves by the amount of shots against and can be done on a single game or career scale. The higher the number the better. And shutouts (SO) are the number of games where a goaltender allowed zero goals. Same as the skaters, all of these stats can be displayed to show information just for a single season, across multiple seasons, and a player’s entire career.
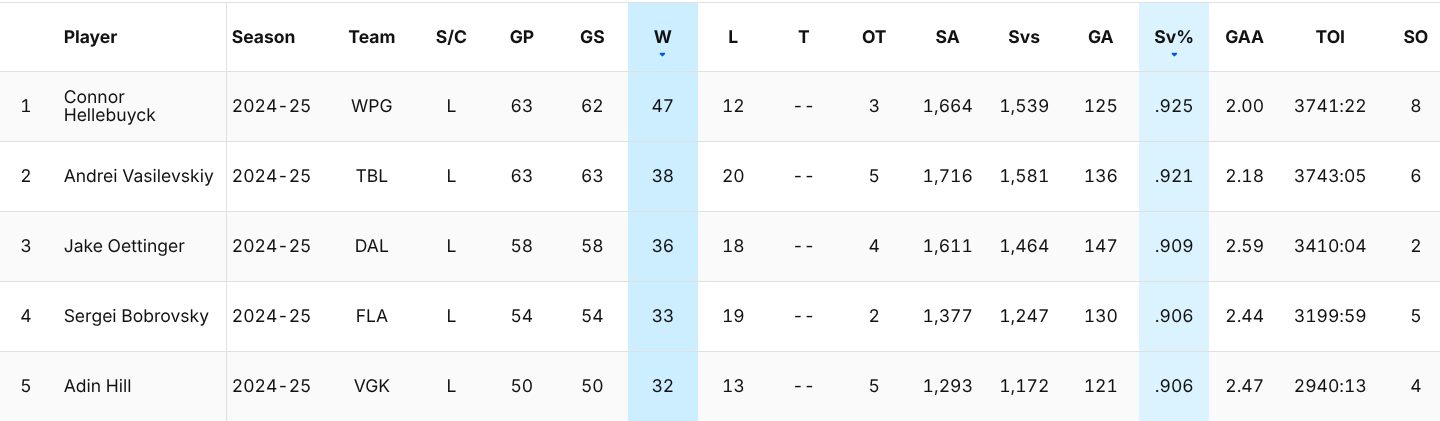
Goaltender stats as displayed on nhl.com
Team Statistics
The last important section of stats left that need to be covered are the team statistics. Every team has a record which reflects the amount of wins, losses and overtime/shootout losses a team has. This statistic will always be displayed by three numbers with hyphens between (ex. 45-30-7). A stat specific to teams are the goals for per game and goals against per game. Goals for per game (GF/GM) is the average number of goals a team scores per game. This can be calculated by dividing a team’s total goals by the number of games played. The higher the number the better for this stat. Goals against per game (GA/GM) is the average number of goals a team allows per game and that can be calculated the same way just with using a team’s total goals allowed. The lower the number the better for this stat. Every team also has a points percentage (P%) which reflects a team’s success by dividing a team’s total points that they have earned by the total possible amount of points in games they’ve played.
We’ll be breaking down all different aspects of hockey throughout the season on the podcast, but let us know if there’s anything specific you’d like to learn about! No matter how much knowledge you have about hockey, you’re welcome here and that’s the most important part.